An early paper on the data flow model, with a particular emphasis on how it was being implemented at Stats NZ. This paper was written by Grace Barnett in 2016.
Steady states - an overview [PDF 350 KB]
This document provides an overview of value chains and steady states, the benefits of and examples of using steady states in the statistical process, explains how steady states relate to other production models at Statistics New Zealand and gives examples of how steady states can enable data sharing and improve data management.
A value chain is a business management concept where production is viewed as a sequence of inputs, transformation processes and outputs. Each transformation process adds value, which accumulates to the final product.

The value chain is a concept often used in manufacturing and a common example used to explain this concept is the diamond industry. The stages in the diamond value chain include mining, sorting, cutting, polishing, and jewellery creation. Each stage adds significant monetary value to the final product.
The flow of information through the statistical process can be viewed as a statistical value chain. We collect raw data and transform it into data with higher value. Data goes through many transformation processes and each adds value to the final product.
Steady states are specified stages in the value chain where the output of a process meets a set of pre-agreed quality indicators. This concept is easily applied to the statistical value chain where data enters, a process occurs and data that meets certain criteria exits. This data is a steady state.

Data goes through many processes and not all are equally important. The use of steady states identifies the milestones in the process which provide assurance that an acceptable level of value has been added to the input data.
The business architecture of Statistics Netherlands recognises six steady states, shown in the simplified graphical representation below. In practise the states are not necessarily linear. An output dataset that is a steady state might be consumed by a different statistical process or a step may be repeated.

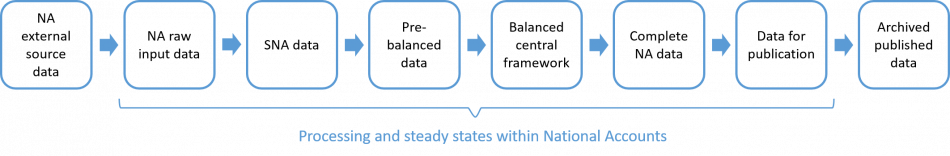
The MATAI project recognises eight steady states for National Accounts, six that are part of the core National Accounts process. Again, this is a simplified graphical representation and the states are not necessarily linear in practice.
Since steady states provide points in the data value chain where an acceptable level of quality is achieved, the quality criteria along with the measures and tolerances for each of those criteria must be agreed as a start.
Establishing these criteria prior to processing means that steady states can serve as strategic monitoring points, helping to identify and isolate potential issues before they become increasingly significant problems further along the value chain.
The criteria or attributes of steady states are determined based on the needs of the organisation but can include the following:
Steady state data must have quality metadata. The concepts, variables, reference period and other relevant metadata must be defined, as well as being standardised across multiple datasets.
To be a steady state the data must satisfy quality standards. These standards must be clearly defined in advance. Data can be reprocessed until standards are met.
Each steady state must have at least one defined user to be relevant and valuable.
Each steady state must have an ‘owner’ responsible for the data design and realisation of quality. At Statistics New Zealand this role would currently be referred to as the ‘data custodian’. The data custodian is responsible for authorising use.
A steady state should be able to be picked up and become an input into another relevant business process. Structural, descriptive and quality metadata allows for this reuse. Centralised storage of steady states (i.e. datasets) can help facilitate this in practice.
There are numerous benefits for identifying and using steady states in statistical production:
Steady states are similar to the concept of quality gates. Quality gates are a project management concept and in simple terms they refer to points in a project’s life cycle when a steering committee or change board can decide whether to continue with the project or not.
In wider process management, a quality gate is a point in a process where the quality of a product is assessed to see if it is meeting the need for which it was designed.
Based on a set of agreed quality criteria and associated measures defined by acceptable tolerances, quality gates can be used to approve output datasets to move on to the next point in the value chain or to initiate corrections or re-processing to mitigate unacceptable levels of errors uncovered in the output datasets.
The statistical process detailed in the GSBPM is also known as a statistical value chain. The GSBPM describes the processes or transformations that data undergoes along this value chain. Steady states can therefore also be mapped to the processes and sub-processes of the GSBPM.

The GSIM is a reference framework for statistical information. It provides a set of standardised, consistently described information objects, which are the inputs and outputs along the statistical value chain.

The key use of GSIM is to provide a common language for statistical information and it can be applied in this way when referring to the inputs and outputs of statistical processes that result in steady states.
Statistics New Zealand has five recognised states along the statistical value chain where data and its associated metadata have agreed disposal outcomes. Disposal refers to what happens to the data once it has fulfilled its statistical or business use. These outcomes are agreed with the Chief Archivist in documents called disposal authorities (DAs).
These points in the value chain are similar to steady states in that they recognise specific instances of output data throughout the statistical process. However, the value added to obtain each state is not clearly enough articulated for these to formally be called steady states.
These Disposal Authority states are:

Statistics New Zealand also operates a data archive for microdata. Copies of final definitive datasets (DA379 1.2) are archived, meeting disposal authority criteria for data in this state.
Because steady states reflect pre-defined quality standards, they can be implemented to help enable data sharing and improve data governance and data management across the System.
A steady state can be identified in the business process of another agency where their data is described and classified to a pre-agreed specification that is most conducive to integration with other data. This steady state then becomes the preferred point in the value chain where data is shared, before the supplying agency moves the data further through their normal business process.
Data from a Statistics New Zealand survey collection has been received and cleaned to an agreed standard and is now a steady state. This data can then provide a consistent input to multiple statistical activities.
In the statistical data value model where data no longer necessarily flows in a linear manner from collection to dissemination, identified steady states across the organisation can form the basis of a data governance model. Roles and responsibilities, such as data custodianship, data policies and data quality standards can all be mapped onto the organisation’s statistical process model, using the steady states as anchor points.
If you’d like more information, have a question, or want to provide feedback, please email datalead@stats.govt.nz.
Content last reviewed 02 July 2021.